Batch Production: Set Batch Size from Changeover Cost
Batch production makes a set quantity of one product per run. The right batch size balances changeover cost per run against holding cost, and nearby sizes cost about the same.

By Praveen Nune, Co-Founder & CEO · Updated 12 Nov 2026
Key takeaways
- Batch production makes one product in set quantities per run. The best batch size is where setup cost per run and holding cost per unit balance, which the economic production quantity formula finds.
- In our worked example, which uses illustrative inputs, the best batch is 4,157 units. Any size from 3,000 to 6,000 costs within 7% of it, so round to what your oven, vessel or shift can take.
- Halving changeover cost cuts the best batch by about 29%, because the best batch moves with the square root of setup cost.
- Cap every calculated batch by shelf life, equipment size and supplier minimums, then give each run one batch number so it can be traced.
In this article
- 1What is batch production, and when does it fit?
- 2How big should one batch be?
- 3What does a worked example in rupees show?
- 4Which mistakes make a batch size cost more than it should?
- 5How do you work out your own batch size in six steps?
- 6How do you keep each batch traceable once it is made?
- 7Frequently asked questions
Every batch run costs the same to set up whatever its size, and every unit left on the shelf costs money to hold. Batch size is the number that balances the two.
That number is a cost decision. Each run carries the same setup work: cleaning, changing tooling, first-pass checks and the labour in between. Run small and you pay for changeovers all year. Run large and your cash sits in stock. Neither mistake shows up on the shop floor until the month-end numbers arrive.
This page gives you the formula, a worked example in rupees, and a six-step sheet you can fill from your own changeover logs. It also says when batch production is the wrong method, and how to keep every batch traceable once it is made. Every figure in the example is illustrative, so you can replace each one with your own. The caps that limit any calculated batch, shelf life, equipment size and supplier minimums, get a pass test of their own.
What is batch production, and when does it fit?
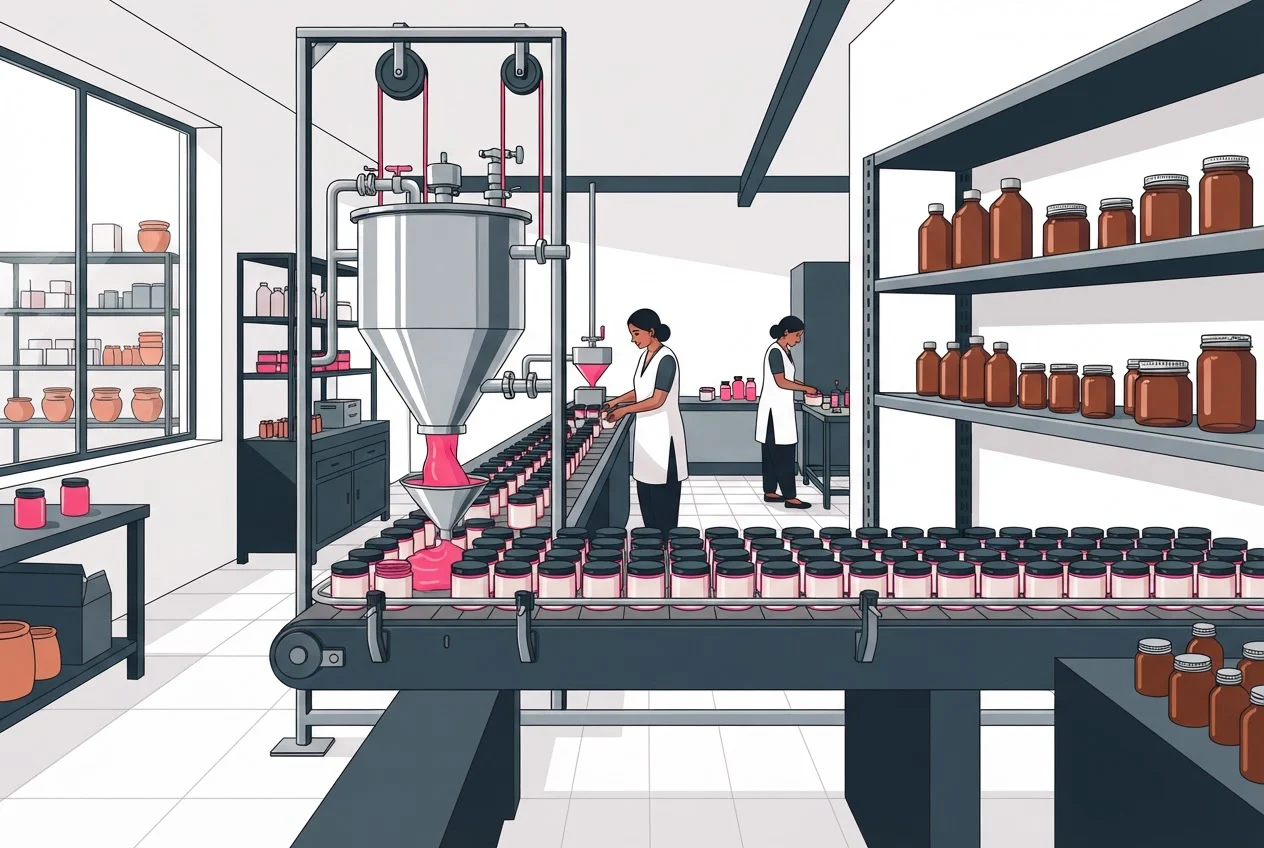
Batch production makes a set quantity of one product in a single run, then stops to clean and reset the equipment before the next product. It fits products that repeat, in volumes too small to justify a dedicated line and too large to treat as one-off jobs.
Definition
| Method | Fits when | What it costs you |
|---|---|---|
| Job production | Each order is one-off or made to a customer's specification | No repeat to spread setup over |
| Batch production | Several products repeat on shared equipment, in moderate volumes | A changeover between runs, and stock held between runs |
| Flow (continuous or mass) production | One standard product, steady high volume, a line that rarely changes | A dedicated line and little flexibility |
Our recommendation is to avoid batching in three cases:
- Changeover cost is close to zero, so you can make to order.
- One product sells steadily enough to keep a line running for weeks. Move that product towards flow production.
- A batch would take longer to sell than the product's shelf life.
How big should one batch be?
The best batch size is the quantity where the setup cost saved by running less often equals the holding cost added by carrying more stock. The economic production quantity (EPQ), also called economic batch quantity, finds it (Wikipedia; MBA Skool).
EPQ = √( 2 × D × S ÷ ( H × (1 − d ÷ p) ) )
- D: annual demand, in units.
- S: setup cost per run, in ₹.
- H: holding cost per unit per year, in ₹.
- d: daily demand, in units.
- p: daily production rate, in units, using the same time unit as d.
The model assumes demand is constant and that setup and holding costs stay fixed (MBA Skool). The formula works only when d and p use the same time unit, daily here. The (1 − d ÷ p) term is there because stock builds more slowly while you are still producing. If you buy rather than make, the economic order quantity drops that term.
To price any batch size Q, use our working: annual cost = (D ÷ Q) × S + Q × (1 − d ÷ p) ÷ 2 × H. Average stock is half the peak, and the peak is Q × (1 − d ÷ p).
What does a worked example in rupees show?
A plant making 24,000 units a year, with a ₹3,500 changeover and ₹10.80 holding cost per unit per year, has a best batch of 4,157 units. That costs ₹40,410 a year in setup and holding, and sizes from 3,000 to 6,000 stay within 7% of it. The inputs are illustrative and the working is ours.
Inputs
- Annual demand D is 24,000 units over 240 working days, so d is 100 a day.
- Output p is 1,000 units a day, so d ÷ p is 0.1.
- Setup S is 3 hours × ₹800 an hour + ₹600 cleaning + ₹500 first-pass checks = ₹3,500.
- Unit cost is ₹60 and the holding rate is 18% a year, so H is ₹10.80.
Best batch: Q = √(2 × 24,000 × 3,500 ÷ (10.80 × 0.9)) = √17,283,951 = 4,157, rounded.
| Batch size | Runs a year | Setup cost (₹) | Holding cost (₹) | Total (₹) | Against best |
|---|---|---|---|---|---|
| 1,000 | 24 | 84,000 | 4,860 | 88,860 | +120% |
| 3,000 | 8 | 28,000 | 14,580 | 42,580 | +5% |
4,157 (best) | 5.8 | 20,207 | 20,203 | 40,410 | best |
| 6,000 | 4 | 14,000 | 29,160 | 43,160 | +7% |
| 12,000 | 2 | 7,000 | 58,320 | 65,320 | +62% |
Four things follow:
- At the best batch, setup cost and holding cost are equal, apart from rounding the batch to whole units.
- The bottom of the curve is flat. You do not need decimal places, so round to a tray, a vessel or a shift.
- The two ends are not equal. A batch of 1,000 costs 120% more than the best, and a batch of 12,000 costs 62% more.
- Cutting the changeover from ₹3,500 to ₹1,750 gives √(2 × 24,000 × 1,750 ÷ 9.72) = 2,940. That is 29% smaller, so setup time is the lever worth working on.
Which mistakes make a batch size cost more than it should?
A common habit, in our judgement, is to set batch size by oven load, vessel size or order size, which ignores both setup cost and holding cost. This is our inference, not a surveyed figure. The worked example above shows what that costs.
Four errors follow, and they are our reading of the example above:
- Leaving lost output out of S. A common mistake, in our judgement, is to leave lost output out of S. The example above omits it for simplicity. A plant that loses output during changeovers should add that cost to S, otherwise S is too low and batches come out too small.
- Using the order-quantity formula for your own production. In the example it gives 3,944 instead of 4,157, about 5% too small.
- Ignoring the caps. A calculated batch that outlasts shelf life or overfills the vessel is not a batch you can run.
- Never re-running the number. The best batch moves with 1 ÷ √H, so a 20% rise in holding cost cuts it by about 9%. Re-run the formula whenever your interest or storage cost changes.
How do you work out your own batch size in six steps?
Fill five inputs from your own records, calculate the EPQ, cap it, round to a practical size and price the result. Each step below has a pass test you can run.
- Cost one changeover (S).Add the hours from the last good unit of the old product to the first good unit of the new one, multiplied by labour plus machine cost per hour, plus cleaning materials and first-pass check samples. Pass: S is built from logged times for at least your last five changeovers, and every line is traceable. Fail: a round number nobody can trace.
- Set holding cost per unit per year (H).
Multiply unit cost by your annual holding rate. The rate covers interest on the cash tied up, storage, insurance and spoilage. Build yours using inventory carrying cost. Pass: the rate has at least an interest line and a storage line with your own numbers. Fail: copying the 18% from the example.
- Get d and p in the same unit.
d is annual demand divided by working days. p is realistic daily output including stoppages, not nameplate speed. Pass: p is larger than d. If p is not larger, the formula has no answer: you are capacity-limited, so plan around capacity first (production planning and control).
- Calculate the batch.Use the spreadsheet block below.
- Cap it.
The batch must pass three tests:
- Shelf life: Q ÷ d, the days to sell a batch, is shorter than the shelf-life days left after dispatch and transit.
- Equipment: Q fits whole loads of your oven, vessel or tray.
- Supplier minimums: the raw material for one batch can be bought in your supplier's order sizes.
Pass: all three hold. If a cap binds, use the cap.
- Price the practical size.Put the capped figure in the annual-cost formula. Pass: you know how much the cap costs against the EPQ. If that gap is large, work out whether a smaller changeover or a bigger vessel pays back.
B1  Annual demand D (units)          24000
B2  Setup cost per run S (₹)         3500
B3  Holding cost H (₹/unit/year)     10.80
B4  Daily demand d (units/day)       =B1/240
B5  Daily output p (units/day)       1000
B6  Best batch Q                     =SQRT(2*B1*B2/(B3*(1-B4/B5)))
B7  Practical batch (your choice)    3000
B8  Annual cost at B7 (₹)            =B1/B7*B2+B7*(1-B4/B5)/2*B3
How do you keep each batch traceable once it is made?
Record the product's bill of materials (BOM, the list of materials in one unit), run production against it, and carry one batch number from raw material to finished stock. In Arka Inventory we keep those steps in one place, so a batch you sized above is a batch you can follow.
One bulk run often fills several pack sizes. Treat the bulk run as the batch, and give each pack-size lot the bulk batch number as its parent. A complaint about a one-litre can then leads back to the bulk run and the materials used. If one order is made in chunks, give each chunk its own batch number.
Here is what we offer for this:
- Bills of materials: standard and order-based, with an availability check of stock against the BOM before you plan the run. See bill of materials software.
- Production tracking: tracking of the materials used for a particular production batch, with visibility of production cost and work in progress, across manufacturing set-ups from process to discrete.
- Lot tracking: tracking of inventory by batch and expiry date. See lot and serial tracking.
- Plans: as of November 2026, the Advance plan, which includes bills of materials and production, costs $499 a month billed annually; lot and serial tracking needs the Enterprise plan, which is custom priced (pricing page).
To turn batch cost into a cost per unit, build the schedule in cost of goods manufactured.
We offer a 15-day free trial with full access to all features and no credit card. Setup typically takes at least two weeks, depending on how ready your inventory, product and warehouse data is. Get started on our contact sales page.

Frequently asked questions
In many plants the two terms mean the same thing: a group of units made together under the same conditions. Choose one term, assign one number per production run, and keep it on every pack so any unit traces back to its run. For more, see lot number vs batch number.
Sources
- 1.Economic batch quantity, Wikipedia
- 2.Economic Production Quantity (EPQ), MBA Skool
- 3.Manufacturing, Arka Inventory
- 4.Pricing, Arka Inventory
- 5.Our own working: the ₹ example and the sensitivity figures. All inputs in the example are illustrative.