Inventory Carrying Cost in India: Build Your Own Rate
Inventory carrying cost is a year's cost of holding stock divided by average stock value. In India, your loan rate and stock held per square foot decide it, so calculate it yourself.

By Praveen Nune, Co-Founder & CEO · Updated 25 Oct 2026

Key takeaways
- Your carrying cost rate is annual carrying cost divided by average stock value. In our worked example, a Bengaluru distributor holding ₹1 crore of stock lands at 18.1%.
- In our worked example at ₹10,000 of stock per square foot, interest is the biggest line at 58% of the total. At ₹2,000 per square foot, storage becomes the biggest. SBI's lending benchmark rose to 8.15% plus the bank's spreads on 15 October 2026, and each 0.25 percentage point on EBLR-linked borrowing costs ₹25,000 a year per ₹1 crore of stock.
- Storage cost depends on rupees of stock per square foot more than on the city. The same stock in the same city can cost 2.8% or 13.9% of its value in rent.
- Turn the rate into months: rate ÷ 12 × months of cover tells you what an item has cost to hold before it sells.
In this article
- 1What is inventory carrying cost and how do you calculate it?
- 2Why is a copied 15–30% rate a poor guide for an Indian business?
- 3How much does capital cost add to the carrying cost rate?
- 4How much does storage add, and why does stock per square foot matter more than the city?
- 5Which carrying costs are hidden in your books?
- 6What does the carrying cost worksheet look like?
- 7How do you turn the carrying cost rate into a buying decision?
- 8How does Arka Inventory help you collect the inputs?
- 9Frequently asked questions
A large cost of holding stock rarely appears on a godown invoice: the interest on the money the stock is sitting on, which is booked under finance charges, far from the stockroom.
That is why one number copied from a textbook misleads. A range cannot tell you whether your lender charges 9% or 13%, or whether your stock fills a shelf or a hall.
This page gives you a worksheet to find your own rate in an afternoon, using books you already keep in Tally or a ledger. It shows where each cost hides, what changed in October 2026, and why storage cost depends on stock per square foot. Then it turns the rate into a cost per item, so it can drive a buying decision.
What is inventory carrying cost and how do you calculate it?
Inventory carrying cost is everything you spend in a year to hold stock: interest on the money tied up in it, storage, handling and insurance, and losses from damage, expiry or theft. Divide it by average stock value and multiply by 100 to get the carrying cost rate.
Carrying cost rate (%) = annual carrying cost ÷ average stock value × 100
Annual carrying cost has four lines:
- Capital cost: interest on loans or cash credit (a bank overdraft-style limit secured on stock) funding the stock, or the return your own cash could have earned.
- Storage cost: godown or warehouse rent, power, racking and security.
- Service cost: insurance, handling labour and stock-control software.
- Risk cost: shrinkage (stock lost to theft, damage or counting errors), obsolescence (stock that can no longer be sold) and expiry.
Average stock value is the mean of your stock at cost at each month end. Use twelve month-end values rather than opening plus closing divided by two, because stock that swings with seasons makes the two-point average misleading.
Why is a copied 15–30% rate a poor guide for an Indian business?
A copied range is a poor guide because it cannot see your lender or your storage.
Two of the four cost lines are set by facts about your own business: what your bank charges, and how much stock you hold per square foot of space you pay for. Those two swing the result more than any industry average. In the worked example below, identical stock in the same city gives 18.1% or 29.2%, depending only on how densely the stock is stored.
Our recommendation is to use a published range only as a sanity check after you have built your own.
How much does capital cost add to the carrying cost rate?
Capital cost is the floor under your rate: at State Bank of India (SBI), the External Benchmark Lending Rate (EBLR) is 8.15% plus a credit risk premium and a further spread from 15 October 2026, up from 7.90%. Your sanctioned rate will be higher than the benchmark.
The context, as of October 2026:
- The Reserve Bank of India's policy repo rate was raised by 25 basis points to 5.50% on 7 October 2026. A basis point is 0.01 percentage point.
- SBI's Marginal Cost of Funds based Lending Rate (MCLR) was 8.60% for six months and 8.70% for one year, effective 15 September 2026.
By our arithmetic, a 0.25 percentage point rise on ₹1 crore of average stock funded at EBLR-linked rates adds ₹1,00,00,000 × 0.0025 = ₹25,000 a year. If your loan is linked to the EBLR, it rises with the benchmark. MCLR-linked loans change at their next reset date. Check your sanction letter.
If the stock is funded from your own cash, we would still charge it at the rate you would pay to borrow. That cash could repay the loan or fund purchases.
How much does storage add, and why does stock per square foot matter more than the city?
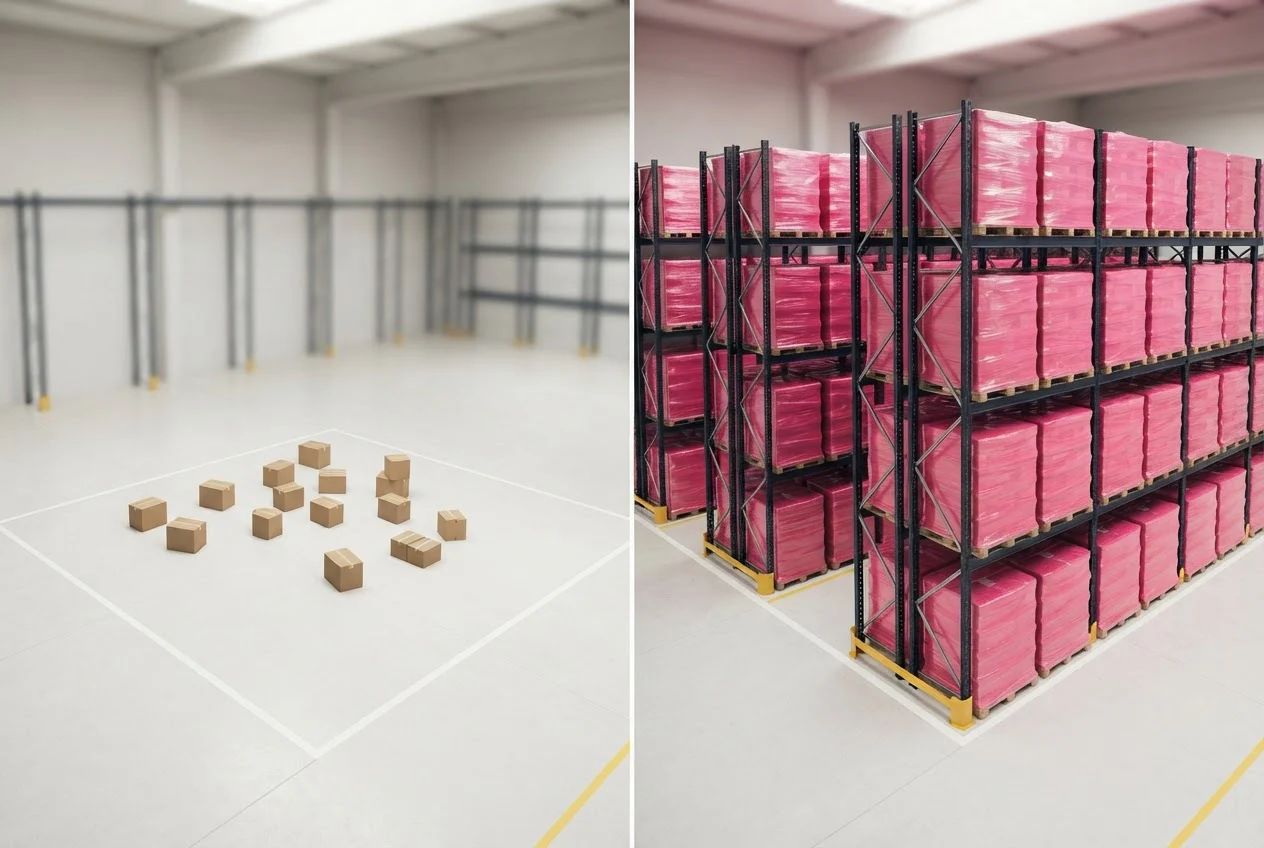
Rent alone adds about 1% to 17% of stock value, and the density of your stock explains more of that range than the city does. The formula is annual rent per square foot ÷ rupees of stock (at cost) held per square foot.
Knight Frank's India Warehousing Market Report (2026 edition, covering 2025) gives weighted average transacted rents per square foot per month: Pune ₹28.0, Mumbai ₹25.2, Chennai and Kolkata ₹25.0, Bengaluru ₹23.2, Delhi NCR ₹21.9, Hyderabad ₹21.5 and Ahmedabad ₹18.6. We multiplied each by 12 and divided by four levels of stock density. This is our model, not an official figure.
| City | Annual rent per sq ft | Stock ₹2,000 per sq ft | ₹5,000 | ₹10,000 | ₹25,000 |
|---|---|---|---|---|---|
| Ahmedabad | ₹223 | 11.2% | 4.5% | 2.2% | 0.9% |
| Hyderabad | ₹258 | 12.9% | 5.2% | 2.6% | 1.0% |
| Delhi NCR | ₹263 | 13.1% | 5.3% | 2.6% | 1.1% |
| Bengaluru | ₹278 | 13.9% | 5.6% | 2.8% | 1.1% |
| Chennai, Kolkata | ₹300 | 15.0% | 6.0% | 3.0% | 1.2% |
| Mumbai | ₹302 | 15.1% | 6.0% | 3.0% | 1.2% |
| Pune | ₹336 | 16.8% | 6.7% | 3.4% | 1.3% |
Add power, racking and security from your own ledgers; they are not in this model.
Read across a row, not down a column. In Bengaluru, the 13.9% for thinly stocked space drops to 1.1% for dense space. Rent reaches 5% of stock value in Bengaluru at ₹5,568 of stock per square foot (₹278.4 ÷ 0.05).
These are rents for large, modern warehouses. A small godown in your town may rent for more or less per square foot, so replace the rent in the formula with the figure on your own rent receipt. To find your density, divide average stock value by the square feet you rent.

What does the carrying cost worksheet look like?
Fill one row per cost line from last year's ledgers, then divide the total by average stock value. A row is only done when it ties to a ledger entry.
| Line | Where to find it | Pass if |
|---|---|---|
| Capital | Interest on cash credit and term loans; for own funds, the borrowing rate × average stock | Interest is the stock-funding share, not total company interest |
| Storage | Rent, power, security and racking lines for the stockroom | Rent matches the lease; shared space is split by area |
| Service | Stock insurance premium, handling wages, stock-software fees | Premium is for stock cover; wages are for stock handling only |
| Risk | Write-offs, damage, expiry, shrinkage found at counts, plus ITC reversed | Write-offs match the stock register |
| Average stock | Twelve month-end stock values at cost | Year-end value ties to the balance sheet within about 1% (our rule of thumb) |
Worked example (our model, with assumed inputs). A Bengaluru distributor holds ₹1,00,00,000 of stock on average, at ₹10,000 per square foot, so it rents 1,000 square feet.
| Line | Working | Annual cost |
|---|---|---|
| Capital | Assumed loan rate 10.5% (SBI's 8.15% plus an assumed 2.35% spread) × ₹1 crore | ₹10,50,000 |
| Storage (rent only) | 1,000 sq ft × ₹278.4 | ₹2,78,400 |
| Service | Assumed insurance ₹1,00,000 + handling wages ₹2,00,000 | ₹3,00,000 |
| Risk | Assumed write-offs ₹1,50,000 + ITC reversed ₹27,000 | ₹1,77,000 |
Total | ₹18,05,400 |
Rate = ₹18,05,400 ÷ ₹1,00,00,000 × 100 = 18.1%. Capital is 58% of the total. Hold the same stock at ₹2,000 per square foot (5,000 square feet) and storage (rent only) becomes ₹13,92,000, so the total is ₹29,19,000 and the rate is 29.2%.
How do you turn the carrying cost rate into a buying decision?
Divide the rate by 12 to get the monthly cost, then multiply by the months an item sits. At 18.1%, holding costs about 1.5% of cost per month, so six months of cover adds about 9% to an item's cost. At 29.2% it adds about 14.6%.
Compare that with the item's gross margin. If six months of cover adds 9% and the item earns 12% gross margin, three points of margin remain. If the cost of holding is higher than the margin, the item loses money for every extra month it sits. We recommend sorting items by months of cover and reviewing anything where the holding cost has passed half the margin.
For order sizing, the economic order quantity uses this rate directly. For the months-of-cover figure, see how to calculate inventory turnover days.
How does Arka Inventory help you collect the inputs?
We give you the two numbers the worksheet starts with: how much stock you hold, and what each unit really cost. Arka Inventory is cloud software built natively on Salesforce, with the following relevant to this calculation.
- Stock across warehouses: see quantities in every warehouse and store in one view, with stock on order and expected arrival. Multiple warehouses are on every plan from Basic.
- Inventory alerts: low-stock and back-order alerts as they happen, from the Basic plan.
- Landed cost: accounts for each unit at its true landed cost, including shipping, duties, taxes and fees, instead of the purchase price alone. It is on our Enterprise plan.
- Lot, batch, expiry and serial tracking: shows what is close to expiry, which feeds the risk line. Also on our Enterprise plan.
- Tally integration: our published integrations include Tally, QuickBooks Online and Salesforce.
We offer a 15-day free trial with full access and no credit card. As of October 2026, Basic costs $199 a month with 1 user and Advance costs $499 a month with 2 users, both billed yearly. Extra users cost $42 a month on Basic and $52 on Advance. Enterprise is custom priced and includes landed cost and lot and serial tracking (pricing). To see how it fits your warehouses, talk to our sales team.
See how Arka Inventory fits your warehouses
Frequently asked questions
List the four annual cost lines in B2:B5 and twelve month-end stock values in C2:C13. Enter =SUM(B2:B5)/AVERAGE(C2:C13) and format the cell as a percentage. Multiply the result by any item's cost to get that item's yearly holding cost.
Sources
- 1.SBI: External Benchmark based Lending Rate, effective 15 October 2026
- 2.SBI: MCLR rates, effective 15 September 2026
- 3.CAclubindia: RBI repo rate rise to 5.50%, 7 October 2026
- 4.Knight Frank: India Warehousing Market Report, 2026 edition
- 5.ICAI: Accounting Standard 2, Inventories
- 6.The Chartered Accountant Journal (ICAI): Loss of goods by fire under GST, December 2024