
Glossary
Gross Margin Return on Inventory Investment (GMROI)
GMROI, or gross margin return on inventory investment, is annual gross profit divided by average inventory at cost. A result of 2.0 means ₹2 gross profit per ₹1 of stock held.

By Praveen Nune, Co-Founder & CEO · Updated 24 Oct 2026
On this page
- 01Definition
- 02Quick facts
- 03What does GMROI mean and how do you calculate it?
- 04How does a worked GMROI calculation look on real Indian accounts?
- 05Which mistakes make a GMROI figure wrong?
- 06What is a good GMROI?
- 07What does GMROI miss, and what is it confused with?
- 08How Arka Inventory handles it
- 09Example
- 10Related terms
- 11Frequently asked
What is GMROI?
GMROI (gross margin return on inventory investment) is a ratio of annual gross profit to the average cost of stock held, showing the gross profit earned per rupee of inventory.
Key takeaways
- On DMart's consolidated figures, GMROI fell from 2.16 in FY2024 to 1.93 in FY2026, because average stock rose about 54% while sales rose about 35%.
- Dividing by closing stock understated DMart's FY2026 GMROI by 7%, and multiplying margin by COGS (cost of goods sold) based turns understated it by 15%.
- There is no universal good GMROI: the target depends on gross margin and stock turns, so compare against your own category and earlier years.
- Treat anything below 1.0 as a warning, since gross profit is then smaller than the cost of the stock carried.
Quick facts
- Formula
- Gross profit ÷ average inventory at cost
- Latest figure
- DMart (consolidated): 1.93 in FY2026
- Rule of thumb
- A typical retailer's GMROI is commonly put above 3.0
- Warning level
- Below 1.0
A business can grow its sales and its gross profit every year and still see GMROI fall. That happens when stock grows faster than the profit it earns, and spotting it is exactly what the ratio is for.
The formula takes one line. The errors come from the inputs. Most wrong GMROI figures trace back to three choices: dividing by closing stock rather than average stock, valuing stock at MRP (maximum retail price) rather than at cost, and pairing margin with the wrong kind of turnover.
You then get a check to run on your own numbers, a straight answer on what counts as a good GMROI, and the points where the ratio misleads. Turnover days, a related but different calculation, has its own page: How to Calculate Inventory Turnover Days from COGS.
What does GMROI mean and how do you calculate it?
GMROI shows how many rupees of gross profit each rupee of stock earns in a year. The formula is gross profit ÷ average inventory at cost. Gross profit is sales minus COGS, the purchase cost of what you sold (Wikipedia).
How GMROI is built from its parts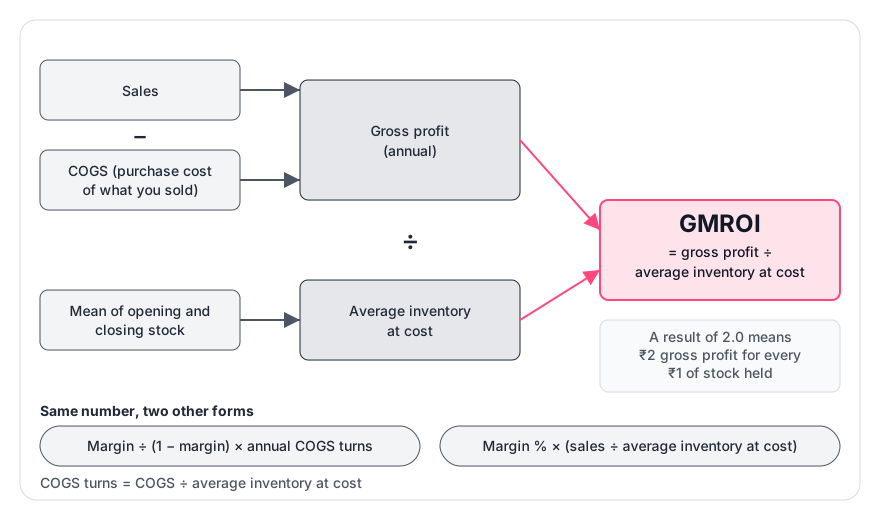
The same number comes from two other forms, which is useful for checking your work:
- Margin ÷ (1 − margin) × annual COGS turns.
- Margin % × (sales ÷ average inventory at cost).
COGS turns are COGS ÷ average inventory at cost: how many times a year you sell through your stock.
Average inventory is the opening and closing stock added and halved. If month-end stock values are available, averaging all 13 points (opening plus 12 month-ends) is recommended, because a two-point average misses seasonal peaks.
How does a worked GMROI calculation look on real Indian accounts?
DMart (Avenue Supermarts, consolidated) works out to a GMROI of 2.16 in FY2024, 2.01 in FY2025 and 1.93 in FY2026. Revenue and gross profit (revenue less cost of revenue) are converted from ₹ million on StockAnalysis. Average stock is the mean of opening and closing inventories on IIFL. Data read in October 2026.
Revenue (₹ crore) was 50,789 in FY2024, 59,358 in FY2025 and 68,821 in FY2026.
Gross margin barely moved (14.4% in FY2024, 14.5% in FY2025, 14.7% in FY2026). From FY2024 to FY2026, revenue grew 35% and gross profit grew 38%, but average stock grew 54%, so each rupee of stock earned less. Growth alone did not protect the ratio.
The averages use two points, opening and closing, so in-year seasonal peaks are not captured.
- Year
- FY2024
- Gross profit (₹ crore)
- 7,330.4
- Opening / closing stock
- 3,055.56 / 3,723.43
- Average stock
- 3,389.5
- GMROI
- 2.16
- Year
- FY2025
- Gross profit (₹ crore)
- 8,582.9
- Opening / closing stock
- 3,723.43 / 4,805.45
- Average stock
- 4,264.4
- GMROI
- 2.01
- Year
- FY2026
- Gross profit (₹ crore)
- 10,096.5
- Opening / closing stock
- 4,805.45 / 5,630.44
- Average stock
- 5,217.9
- GMROI
- 1.93
Which mistakes make a GMROI figure wrong?
Three mistakes account for most wrong GMROI figures: using closing stock, valuing stock at MRP, and mixing margin with the wrong turnover. On DMart's FY2026 data:
The MRP error works the same way. If stock costing ₹100 carries an MRP of ₹125 (a made-up illustration), dividing by ₹125 gives a result 20% too low.
Run these three tests on your own numbers:
- Is stock at cost? Pass: values come from purchase invoices, with import costs added, under a consistent costing method such as FIFO or weighted average cost. Fail: stock is valued at MRP or selling price.
- Is stock averaged? Pass: at least opening and closing, ideally 13 month-end values. Fail: closing stock alone. This understates GMROI when stock is growing and overstates it when stock is shrinking.
- Do the two forms agree? Compute gross profit ÷ average stock, then margin ÷ (1 − margin) × COGS turns. Pass: they match to rounding. Fail: if your version gives a lower number, you multiplied margin by COGS turns.
- Method
- Gross profit ÷ average stock at cost
- Result
- 1.93
- Against correct
- correct
- Method
- Gross profit ÷ closing stock
- Result
- 1.79
- Against correct
- 7% low
- Method
- Margin % × COGS turns (14.67% × 11.3)
- Result
- 1.65
- Against correct
- 15% low
What is a good GMROI?
A good GMROI depends on your gross margin and how fast you turn stock, so no single figure applies. A common rule of thumb puts a typical retailer's GMROI above 3.0 (Wikipedia). A high-volume, low-margin grocer such as DMart sits below that, at 1.93 in FY2026, because turns cannot make up for a 14.7% margin. Wikipedia also notes it is "virtually impossible to set a precise goal".
The arithmetic shows why. To reach 3.0 on a 5% margin you would need about 57 turns a year. DMart, at 14.7% margin and 11.3 turns, reached 1.93 in FY2026.
Set the target from your own margin and turns, then compare with your last four quarters and with similar products. Treat anything below 1.0 as a warning, because gross profit is then smaller than the cost of the stock carried, before any rent or salaries.
What does GMROI miss, and what is it confused with?
GMROI measures gross profit only, so it ignores rent, salaries, interest and the cost of holding stock. It is not a net return, and 2.0 does not mean 200% profit.
- Sold-out items look best. A product that sells out completely shows an artificially strong GMROI (Wikipedia). Check for lost sales before celebrating.
- Turnover is not GMROI. Turnover counts how fast stock sells. GMROI counts the margin rupees produced. A fast-selling, thin-margin item can still score low.
- GMROS (gross margin return on space) is gross profit per unit of selling area, a space measure, not a stock measure.
How Arka Inventory handles it
Arka Inventory is built natively on Salesforce and does not publish a GMROI report. Its custom reports and dashboards give tailored, real-time views of inventory and performance, so stock quantities and values by location can be charted each month, with cost values taken from the costing method. For what to chart, see Inventory Dashboard: What to Show and the Action Table to Build.
As of 24 October 2026, the Enterprise plan tracks landed cost, the figure "inventory at cost" should reflect for imported goods; see Landed Cost Calculation for Imports into India.
As of 24 October 2026, pricing is Basic $199 a month and Advance $499 a month, both billed annually, with custom pricing on Enterprise. Typical onboarding takes a minimum of two weeks, and a 15-day free trial gives full access with no credit card.
Example
A made-up illustration: a distributor on a 5% gross margin turning stock 10 times a year earns 0.05 ÷ 0.95 × 10 = 0.53. At 8% and 12 turns it earns 1.04.
Frequently asked
Sources
- 1.Gross margin return on inventory investment, Wikipedia, Wikipedia
- 2.Avenue Supermarts (DMart) annual financials, StockAnalysis, StockAnalysis, October 2026
- 3.Avenue Supermarts balance sheet, IIFL, IIFL, October 2026