
Glossary
Weighted Average Cost Method
The weighted average cost method values stock at total cost divided by total units, calculated once per period or after every receipt. Indian standards permit it alongside first-in, first-out.

By Praveen Nune, Co-Founder & CEO · Updated 23 Oct 2026
On this page
- 01Definition
- 02Quick facts
- 03What is the weighted average cost method?
- 04How do periodic and moving weighted average differ on the same stock?
- 05Periodic against moving average on the October ledger
- 06Which cost formulas do Indian rules allow, and can you switch?
- 07Why do two "weighted average" systems still disagree?
- 08How can you test which average your stock software runs?
- 09How Arka Inventory handles it
- 10Example
- 11Related terms
- 12Frequently asked
What is the weighted average cost method?
The weighted average cost method assigns every unit of an interchangeable item the same cost: total cost of opening stock plus purchases, divided by total units available.
Key takeaways
- Each purchase is weighted by its quantity, so the result is not the simple average of purchase prices.
- "Periodic" and "moving" weighted average give different COGS from identical transactions: ₹77,350 against ₹74,136 on the October ledger.
- Indian rules allow first-in, first-out (FIFO) or weighted average, applied consistently. Last-in, first-out (LIFO) is not on the list.
- The label does not tell you what your software does. Five tests below show it.
Quick facts
- Allowed under
- Ind AS 2 paragraph 25 and ICDS II paragraph 16
- Variants
- Periodic (one average per period) and moving (recalculated after every receipt)
- Suits
- Identical goods mixed in the bin, such as bulk chemicals, fasteners, cement and packaging film
- Alternative formula
- First-in, first-out (FIFO)
What is the weighted average cost method?
Two stock systems can take the same purchases and the same sales, both say they use weighted average cost, and report profit that differs by thousands of rupees. The name covers two calculations.
Periodic weighted average finds one average for the whole period after it closes. Moving average, the version a perpetual system (one that updates stock after every transaction) runs, recalculates after every receipt. Indian Accounting Standard (Ind AS) 2 allows both, so the label alone settles nothing.
On the six-line October ledger below, the two versions differ by ₹3,214 of cost of goods sold (COGS, the cost of the units you sold). Backdated purchases, late freight invoices and the treatment of issues (stock sent out of the warehouse, whether sold or used) give two "weighted average" systems further ways to disagree.
This entry defines the method, sets out the Indian rules, and ends with a five-test sheet you can run on Tally, a spreadsheet or any software you are evaluating.
Units are weighted by quantity, so a large cheap purchase pulls the average further than a small dear one.
Formula: average cost per unit = (opening stock value + purchases value) ÷ (opening units + purchased units).
It suits goods that are identical and mixed in the bin: bulk chemicals, fasteners, cement, packaging film. It suits goods you can trace to a specific purchase less well.
How do periodic and moving weighted average differ on the same stock?
Periodic weighted average uses one cost for the whole period. Moving average recalculates after each receipt and prices each sale at the average on that day. Ind AS 2 paragraph 27 allows either: "on a periodic basis, or as each additional shipment is received" (ICAI, Ind AS 2).
Periodic against moving average, side by side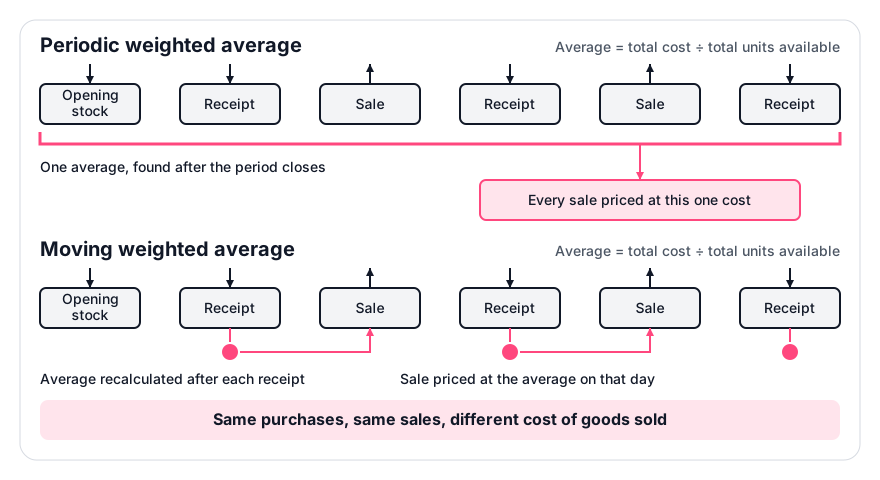
Worked example (figures calculated for illustration; stock in kg):
- Date
- 1 Oct
- Event
- Opening stock
- Qty
- 200
- Rate
- ₹100
- Date
- 4 Oct
- Event
- Purchase
- Qty
- 300
- Rate
- ₹110
- Date
- 9 Oct
- Event
- Sale
- Qty
- 350
- Rate
- Date
- 15 Oct
- Event
- Purchase
- Qty
- 400
- Rate
- ₹130
- Date
- 22 Oct
- Event
- Sale
- Qty
- 300
- Rate
- Date
- 27 Oct
- Event
- Purchase
- Qty
- 100
- Rate
- ₹140
Periodic against moving average on the October ledger
Working for the moving-average column (an illustrative model, not an official figure): 4 Oct: (₹20,000 + ₹33,000) ÷ 500 kg = ₹106.00. 9 Oct sale: 350 × ₹106.00 = ₹37,100; 150 kg left, worth ₹15,900. 15 Oct: (₹15,900 + ₹52,000) ÷ 550 kg = ₹123.45. 22 Oct sale: 300 × ₹123.4545 = ₹37,036.36; 250 kg left, worth ₹30,863.64. 27 Oct: + ₹14,000 = ₹44,863.64 for 350 kg. COGS = ₹37,100 + ₹37,036.36 = ₹74,136.36.
Both reconcile to ₹119,000. The COGS gap is ₹3,213.64, which is 4.3% of the moving-average figure. That percentage belongs to this ledger only; it grows or shrinks with price movement. For the FIFO comparison, see the FIFO inventory method page. For a second moving-versus-periodic example, see the perpetual inventory system page.
- Method
- Periodic
- Cost per unit
- ₹119.00 (₹119,000 ÷ 1,000)
- COGS
- ₹77,350
- Closing stock (350 kg)
- ₹41,650
- Method
- Moving
- Cost per unit
- ₹106.00 on 9 Oct, ₹123.45 on 22 Oct
- COGS
- ₹74,136.36
- Closing stock (350 kg)
- ₹44,863.64
Which cost formulas do Indian rules allow, and can you switch?
For interchangeable stock, Ind AS 2 paragraph 25 allows FIFO or weighted average cost, and requires "the same cost formula for all inventories having a similar nature and use". Paragraph 26 adds that a difference in "the respective tax rules" does not justify a different formula (ICAI, Ind AS 2).
Tax follows the same pair. Income Computation and Disclosure Standard (ICDS) II, paragraph 16, allows FIFO or weighted average, and paragraph 23 says a method once adopted "shall not be changed without reasonable cause" (Notification 87/2016, 29.09.2016). As of 23 October 2026, section 277 of the Income-tax Act 2025, in force from 1 April 2026, values inventory at the lower of cost or net realisable value (the expected selling price less costs to sell) under the ICDS (Income Tax Department, section 277). Confirm the current ICDS text with your chartered accountant.
Ind AS 2 paragraph 11 puts import duties, transport and handling in cost, but not taxes the entity can later recover. Recoverable Goods and Services Tax (GST) stays out of unit cost; see the landed cost calculation page.
Why do two "weighted average" systems still disagree?
They disagree because the formula's inputs differ: whether issues reduce the base, how a backdated receipt is treated, and where a late invoice lands.
- Issues. Tally's Sales Profitability report states cost of sale as quantity × total inward value in the year ÷ total inward quantity in the year, and presents the result as an estimate of profitability (TallyHelp). Issues do not reduce that base. On the October ledger, if opening stock counts as inward, this costs the 22 Oct sale at ₹116.67 (₹105,000 ÷ 900 kg); if it does not, at ₹121.43 (₹85,000 ÷ 700 kg). Moving average gives ₹123.45.
- Backdated purchases. Dynamics 365 costs a backdated entry at the current average and leaves earlier costs alone (Microsoft Learn). As an illustration, a system that re-costs later issues would behave differently: 100 kg at ₹150 dated 3 Oct but entered on 20 Oct would give ₹39,666.67 for the 9 Oct sale instead of ₹37,100.
- Late invoices. Dynamics 365 spreads a receipt-to-invoice difference over the stock still on hand and expenses the rest (Microsoft Learn). Freight that reaches the profit and loss account instead of stock is a policy choice you should make deliberately.
How can you test which average your stock software runs?
Run the October ledger through your system and compare against the expected answers. Each test passes only if you can see the figure in a report.
Choose moving average if receipts are posted on the day they arrive, and periodic average if stock is only counted at month end. Write the result of tests 4 and 5 into your costing policy.
- Test
- 1. Reconcile
- Pass
- COGS + closing stock = ₹119,000
- Fail
- Gap of even ₹1
- Test
- 2. Method
- Pass
- 9 Oct sale costed at ₹106.00 (moving) or ₹119.00 (periodic)
- Fail
- Neither figure appears
- Test
- 3. Issues
- Pass
- 22 Oct sale costed at ₹123.45 (moving) or ₹119.00 (periodic)
- Fail
- Any other figure, unless the report states its formula and you can reproduce it
- Test
- 4. Backdated
- Pass
- After 100 kg at ₹150 dated 3 Oct is entered on 20 Oct, the 9 Oct sale stays ₹37,100 (no re-costing), or changes to ₹39,666.67 with the revision visible in an audit log
- Fail
- Any other figure, or a change with no log
- Test
- 5. Late freight
- Pass
- Post ₹5,000 freight for the 4 Oct receipt on 20 Oct; a report splits the ₹5,000 between closing stock and COGS (for example in proportion to the stock still on hand), and the two parts add to ₹5,000
- Fail
- You cannot find the ₹5,000, or the parts do not add to it
How Arka Inventory handles it
Average cost is only as good as the unit cost fed into it. Our landed cost feature allocates shipping, duties, taxes and fees to inventory items, so each unit is carried at its landed cost rather than just the purchase price. Allocate only non-recoverable taxes and duties; leave recoverable GST out.
We publish integrations with Tally and QuickBooks Online. Our 15-day free trial gives full access with no credit card, so you can run the five tests above on any system you evaluate, ours included. To book a demo, contact our sales team.
Example
Take 50 units bought at ₹20 and 150 units bought at ₹24. The simple average of the two prices is ₹22, but the weighted average is ₹4,600 ÷ 200 = ₹23.00 per unit, because the larger purchase counts for more.
Frequently asked
Sources
- 1.Ind AS 2 Inventories, paragraphs 11, 25–27, ICAI
- 2.Ind AS 8 educational material, ICAI
- 3.ICDS II, Notification 87/2016 dated 29.09.2016, paragraphs 16, 23 (text via TaxGuru), TaxGuru, 2016-09-29
- 4.Section 277, Income-tax Act 2025, Income Tax Department
- 5.Sales profitability report, average cost formula, TallyHelp
- 6.Moving average, Dynamics 365 Supply Chain Management, Microsoft Learn, 2026-09-01