
Glossary
Stockout
A stockout is when an item you need to sell or use has no stock available. In a 2002 grocery retail compilation, most cases began in the store's ordering and stock handling.

By Praveen Nune, Co-Founder & CEO · Updated 23 Oct 2026
Also called Stock-out, Stock out or स्टॉक से बाहर
On this page
- 01Definition
- 02Quick facts
- 03What is a stockout, and what is it confused with?
- 04What are the three kinds of zero in a stockout?
- 05Where do most stockouts start: suppliers or your own process?
- 06How do you measure and cost a stockout?
- 07What should a stockout log record?
- 08How Arka Inventory handles it
- 09Example
- 10Related terms
- 11Frequently asked
What is a stockout?
A stockout is the moment an item you need to sell or use has no stock available. It is also written stock-out or stock out.
Key takeaways
- A stockout means no stock is available when an order, dispatch or production run needs it.
- Split every stockout into one of three zeros: nothing on hand, nothing available after commitments, or an empty bin while the system shows stock.
- In the 2002 grocery retail compilation, 72% of stockouts began in the store and 28% upstream; test this against your own log.
- Quote a stockout rate only with its base: SKU-days (one stock keeping unit, or SKU, meaning one distinct item code, at zero available for one day) divided by active SKUs times days. Count empty-bin events separately.
Quick facts
- Also written
- Stock-out, stock out
- In Hindi
- स्टॉक से बाहर
- Rate base
- SKU-days at zero available ÷ (active SKUs × days) × 100
- Cause codes
- A ordering or forecast, B record error, C supplier late, D stock already promised
- Written for
- Owners and stores teams in Indian manufacturing and distribution who hold physical stock
Three people can say they had a stockout and mean three different things. The system shows zero on hand. Or every unit is already promised to another customer. Or the system shows six units and the bin is empty.
Each case needs a different fix. Ordering earlier cures the first. Counting only unpromised stock cures the second. Neither touches the third, which is a records problem.
This page defines the term, separates the three zeros and gives you a rate formula, a cost calculation and a log you can copy into a spreadsheet. It is written for owners and stores teams in Indian manufacturing and distribution who hold physical stock.
What is a stockout, and what is it confused with?
A stockout is the moment an item you need to sell or use has no stock available, so an order, a dispatch or a production run must wait or be refused. In Hindi it is स्टॉक से बाहर (Hinkhoj).
A backorder is different: the customer can still order and is given a delivery date. A low-stock warning is not a stockout either. It is the signal that comes before one.
Related terms:
- Safety stock: the buffer held against surprises. See safety stock calculation.
- Reorder point: the stock level that triggers a new order. See reorder point formula.
- Lead time: the days between placing an order and receiving it.
- SKU (stock keeping unit): one distinct item code.
What are the three kinds of zero in a stockout?
A stockout can mean zero on hand, zero available, or zero at the pick location while the system still shows stock. Keep them apart, because each has a different cause and a different person who can fix it.
Three kinds of zero behind a stockout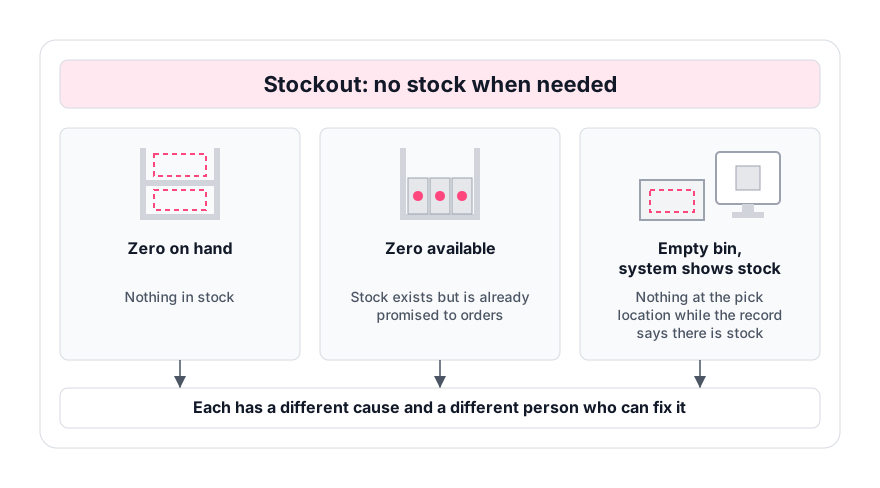
- Zero
- On hand is 0
- Test
- System quantity is 0 in every warehouse
- Example
- 0 units anywhere
- Usual fix
- Purchase or production order
- Zero
- Available is 0
- Test
- On hand minus stock committed to open orders is 0
- Example
- 12 on hand, 12 promised
- Usual fix
- Stop promising; reallocate or expedite
- Zero
- Pick location is 0, system shows stock
- Test
- Picker finds an empty bin where the system shows more than 0
- Example
- System 6, bin 0
- Usual fix
- Count, correct, and find the cause (see inventory discrepancy causes)
Where do most stockouts start: suppliers or your own process?
In a 2002 compilation of grocery retail studies, 72% of stockouts began inside the store and 28% upstream of it. Gruen, Corsten and Bharadwaj's report for the Grocery Manufacturers of America gives 47% from store ordering and forecasting, 25% from stock in the store but not on the shelf, and 28% from upstream causes (Exhibit 2 of its executive summary). The two store-side shares sum to 72%.
The report covered 52 studies in 29 countries and fast-moving consumer goods retail, so it is not Indian business-to-business data. The inference is that distributors with many fast-moving SKUs see the same pattern, but a business's own log should confirm it.
Record errors feed this directly. DeHoratius and Raman found 65% of about 370,000 inventory records inaccurate in 37 stores of one retailer (Management Science, 2008). In a study of seven European retailers, about 60% of audited SKUs had record errors, and correcting them lifted sales by 3.8% to 8.4% across the retailers, 6.0% on average (ECR Retail Loss). Fast-moving items gained most from the corrections.
Recommendation: count the fastest-moving items first. See cycle counting.
How do you measure and cost a stockout?
Measure the rate as SKU-days at zero available (zero on hand, or zero available after commitments, as the system shows) divided by active SKUs times days in the period, multiplied by 100. Cost one stockout as units demanded, times the share of buyers who walk away, times margin per unit. Both are models, not official figures.
Rate, worked example (illustrative): 120 active SKUs over 30 days is 3,600 SKU-days. If 108 SKU-days sat at zero available, the rate is 108 ÷ 3,600 = 3.0%. Always state the base. The 2002 report's 8.3% average comes from shelf audits at a single point in time, so it should not be compared with a SKU-day rate.
Empty-bin events: the third zero is invisible to this rate, because the system still shows stock. Record those separately as SKU-days where a count found the bin empty, and report that figure next to the rate.
Cost, worked example (illustrative): demand of 40 units a day for a 5-day stockout is 200 units. The 2002 report found 31% of shoppers bought elsewhere and 9% did not buy, so 40% is used as lost. That gives 80 units. At ₹150 margin a unit, lost margin is 80 × ₹150 = ₹12,000. Those are retail shoppers. After a quarter of logging, replace 40% with your own share of lost orders.
What should a stockout log record?
A stockout log should record the item, the dates, the quantities and one cause code, so you can total causes by quarter. Copy this layout into a spreadsheet; the example row reuses the figures from the cost example above.
| SKU | Start | End | Days at zero | On hand | Available | Open PO and date | Daily demand | Orders lost or delayed | Bin empty at count | Cause code (A-D) | Owner |
|---|---|---|---|---|---|---|---|---|---|---|---|
| Item code | Date | Date | 5 | 0 | 0 | PO number, date | 40 | 80 units | No | A | Name |
Pass/fail tests for each row:
- Days at zero equals End minus Start.
- Cause code is one of A, B, C or D. A row that gives no cause fails.
- Bin empty at count is Yes or No, and a Yes row carries code B.
Four cause codes split the study's store-ordering, in-store stock and upstream groups as follows:
- A ordering or forecast (store ordering and forecasting)
- B record error or stock not at the pick location (in the store, not on the shelf)
- C supplier late (upstream)
- D stock already promised to another order (in this reading, store ordering and forecasting)
How Arka Inventory handles it
We built Arka Inventory so each kind of zero shows up before an order is lost. For zero on hand, our inventory alerts flag items approaching or below minimum stock and tell users when back-ordered stock arrives; as of October 2026, alerts and purchase orders are included in the Basic plan and above (pricing). Set thresholds on sellable stock as described in low stock alert.
For zero available, Commit Inventory lets you commit stock to orders and allocate or reallocate it by delivery date, so sales sees what can be promised, not only what is physically on hand. For zero in the bin, we show stock by warehouse, and by bin on our Enterprise plan, so a counter can compare the record with the shelf. Follow cycle counting to schedule counts.
Example
A picker is sent to a bin where the system shows 6 units and finds it empty. The stockout is logged with On hand 6, Bin empty at count Yes and cause code B, and the record is corrected after a count. No purchase order is raised on the strength of this row, because the cause is a records error rather than a shortage.
Frequently asked
Sources
- 1.Retail Out-of-Stocks: A Worldwide Examination of Extent, Causes and Consumer Responses, Grocery Manufacturers of America, 2002
- 2.Inventory Record Inaccuracy: An Empirical Analysis, Management Science, 2008
- 3.Measuring the Sales Impact of Improving Inventory Records, ECR Retail Loss
- 4.Stockout meaning in Hindi, Hinkhoj