
Glossary
Sell-Through Rate
Sell-through rate is the percentage of the stock available in a period that you actually sold. Choose opening stock plus receipts as the base, net off returns, and state the period.

By Praveen Nune, Co-Founder & CEO · Updated 24 Oct 2026
On this page
- 01Definition
- 02Quick facts
- 03Which base sell-through rate should use
- 04Why one month of stock gives 175%, 88% or 55%
- 05What counts as a good sell-through rate
- 06Sell-through between manufacturer, distributor and retailer
- 07Sell-through rate vs rate of sale and inventory turnover
- 08How Arka Inventory handles it
- 09Example
- 10Related terms
- 11Frequently asked
What is sell-through rate and how is it calculated?
Sell-through rate is the share of the stock you had available in a period that you sold in that period, shown as a percentage.
Key takeaways
- A rate above 100% means the base left out stock that was sold, usually opening stock or an unrecorded receipt. Divide by opening stock plus units received.
- A good rate depends on category and timing. Compare each line with its own history for the same window, not with a universal figure.
- Manufacturers and distributors should name the hop they measure: shipments to distributors, or distributors' sales on to retailers.
Quick facts
- Recommended formula
- (units sold − units returned to stock) ÷ (opening stock + units received) × 100
- Period
- One month for steady lines; the full selling season for seasonal goods
- Warning sign
- A result above 100% points to a base that left out stock
- Compare against
- The same line's history for the same category, window length and point in the season
One month of stock can produce a sell-through rate of 175%, 88% or 55%, and each figure comes from a formula in common use. The gap is not arithmetic. It is the base, the number you divide by.
In one eBay Community thread, a reseller asked whether to divide 500 sales in 90 days by 3 and then by 1,500 listings. Two replies to the same question gave 33% and 25% because they divided by different bases.
That matters because the rate drives reorders, markdowns and the conversation between a manufacturer and its distributors. A number with no stated base cannot be compared with last month, with another product line or with a supplier's figure.
Which base sell-through rate should use
The recommended formula is: (units sold − units returned to stock) ÷ (opening stock + units received) × 100. Use one month for steady lines and the full selling season for seasonal goods.
Use opening stock plus units received, because that is everything you could have sold. Units received alone fails whenever sales draw on stock you already held, as the worked example below shows.
Resellers use the same logic with listings. With 88 active listings and 22 sold in 90 days, the rate is 22 ÷ (22 + 88) = 20%. Sales are divided by what was available to sell.
Why one month of stock gives 175%, 88% or 55%
The result changes because each formula counts a different amount of stock. This worked example uses illustrative numbers. Opening stock is 400 units, 200 units are received, 350 are sold and 20 come back into stock, so closing stock is 270 (400 + 200 − 350 + 20).
Three bases, one month, three different rates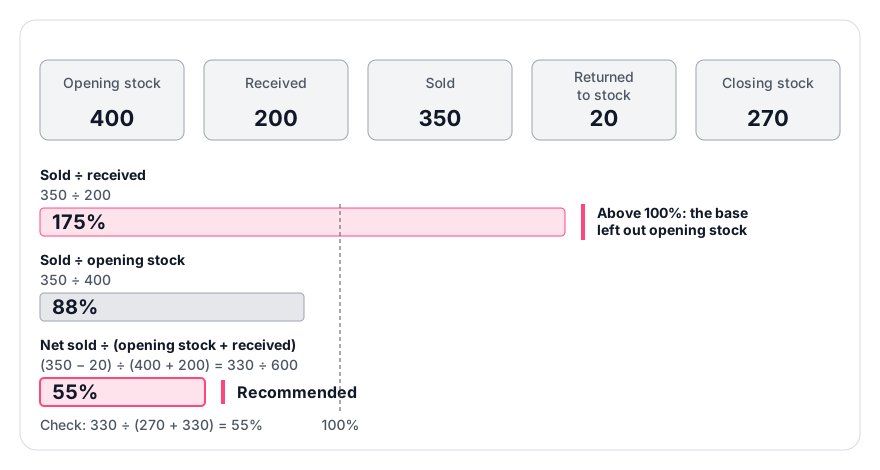
The test: if sold ÷ received exceeds 100%, you sold opening stock as well, so switch bases. Check the last row another way: net units sold ÷ (closing stock + net units sold) = 330 ÷ (270 + 330) = 55%. If the two calculations disagree, a receipt, a sale or a return is missing from the records.
- Formula
- Sold ÷ received
- Working
- 350 ÷ 200
- Result
- 175%
- Formula
- Sold ÷ opening stock
- Working
- 350 ÷ 400
- Result
- 87.5%
- Formula
- Sold ÷ (opening + received)
- Working
- 350 ÷ 600
- Result
- 58.3%
- Formula
- Net sold ÷ (opening + received)
- Working
- 330 ÷ 600
- Result
- 55.0%
What counts as a good sell-through rate
There is no single good figure, because benchmarks vary by category. Marketplace resellers see the same spread: "sell through rates are massively different one person to another and one item to another".
The recommended approach is to judge each line against its own history for the same category, the same window length and the same point in the season. Example only: a line that usually reaches 40% two weeks into a season is doing well at 60%, while a line that ends the season at 60% against a usual 85% needs a markdown review. For a line well below its average, see slow-moving inventory.
- Test
- Rate more than 10 percentage points below the same line's average for the same window
- Action
- List stock older than 90 days
- Test
- Rate above 90% within the first half of the period
- Action
- Check whether stock ran short
- Test
- Rate above 100%
- Action
- Recalculate with opening stock plus units received
- Test
- Rate up while gross margin per unit is down against the previous period
- Action
- Compare the average discount
Sell-through between manufacturer, distributor and retailer
Between a manufacturer, distributor and retailer, sell-through is the share of units shipped to the next party that it has sold on to the party after it. Sell-in is the shipment to that next party. Wikipedia describes sell-through as the percentage of a product sold by a retailer after its supplier ships it.
The terms primary sales (manufacturer to distributor), secondary sales (distributor to retailer) and tertiary sales (retailer to consumer) name each hop.
To measure the manufacturer-to-distributor hop, divide secondary sales by distributors' opening stock plus primary sales. Whichever hop is measured should be named, so that figures can be compared.
Sell-through rate vs rate of sale and inventory turnover
Rate of sale is a speed, not a percentage. It counts units per period, often per store per week. If 480 units sell over 6 weeks across 20 stores, the rate of sale is 480 ÷ 6 ÷ 20 = 4 units per store per week, whether you stocked 500 units or 5,000. It feeds the reorder point.
Inventory turnover is cost of goods sold (COGS) divided by average inventory value for a year. See Calculate Inventory Turnover Days. Sell-through is the short-window, line-level view of the same stock.
- Aspect
- Expressed as
- Sell-through rate
- Percentage
- Rate of sale
- Units per period, often per store per week
- Inventory turnover
- COGS divided by average inventory value
- Aspect
- Period
- Sell-through rate
- Short window, such as a month or a season
- Rate of sale
- Any period, such as a week
- Inventory turnover
- A year
- Aspect
- Level
- Sell-through rate
- Line-level
- Rate of sale
- Per store or per line
- Inventory turnover
- Whole inventory
How Arka Inventory handles it
Arka Inventory is cloud inventory software built natively on Salesforce, with plans listed on our pricing page (as of October 2026). Sell-through rate needs four numbers: opening stock, receipts, sales and returns. We keep them in one system.
- Our Monthly Movements Report tracks opening and closing stock month to month.
- Receiving and returns management record what comes in and what comes back.
- Sales Orders, on our Enterprise plan, record what you sold.
- Our custom reports and dashboards let you tailor reports to the numbers your team reviews.
The formula only works when the stock records are right. Perpetual Inventory System: Test Your Stock Records in India shows how to test them, and Inventory Dashboard covers what to put on screen. Our 15-day free trial needs no credit card.
Example
A manufacturer ships 10,000 units to distributors in a quarter, the distributors held 2,000 units at the start, and they sell 6,500 on to retailers. Dividing secondary sales by distributors' opening stock plus primary sales gives 6,500 ÷ (2,000 + 10,000) = 54%. This is a worked model, not an official figure.
Frequently asked
Sources
- 1.eBay Community: Sell-Through Rate Calculation Question, eBay Community
- 2.eBay Community: Sell-through rate, eBay Community
- 3.Wikipedia: Sell-through, Wikipedia
- 4.Unlocking Efficiency, Our Reporting Capabilities in Action
- 5.Custom Reports and Dashboards
- 6.Pricing plans